
 Japanese
 French
 German
 Korean
 Chinese (Simplified)
Commodity Analysis: Gold Silver and Oil
- Commodities start the week on the backfoot with US jobs in focus
- Gold consolidates within narrow range, silver continues its decline
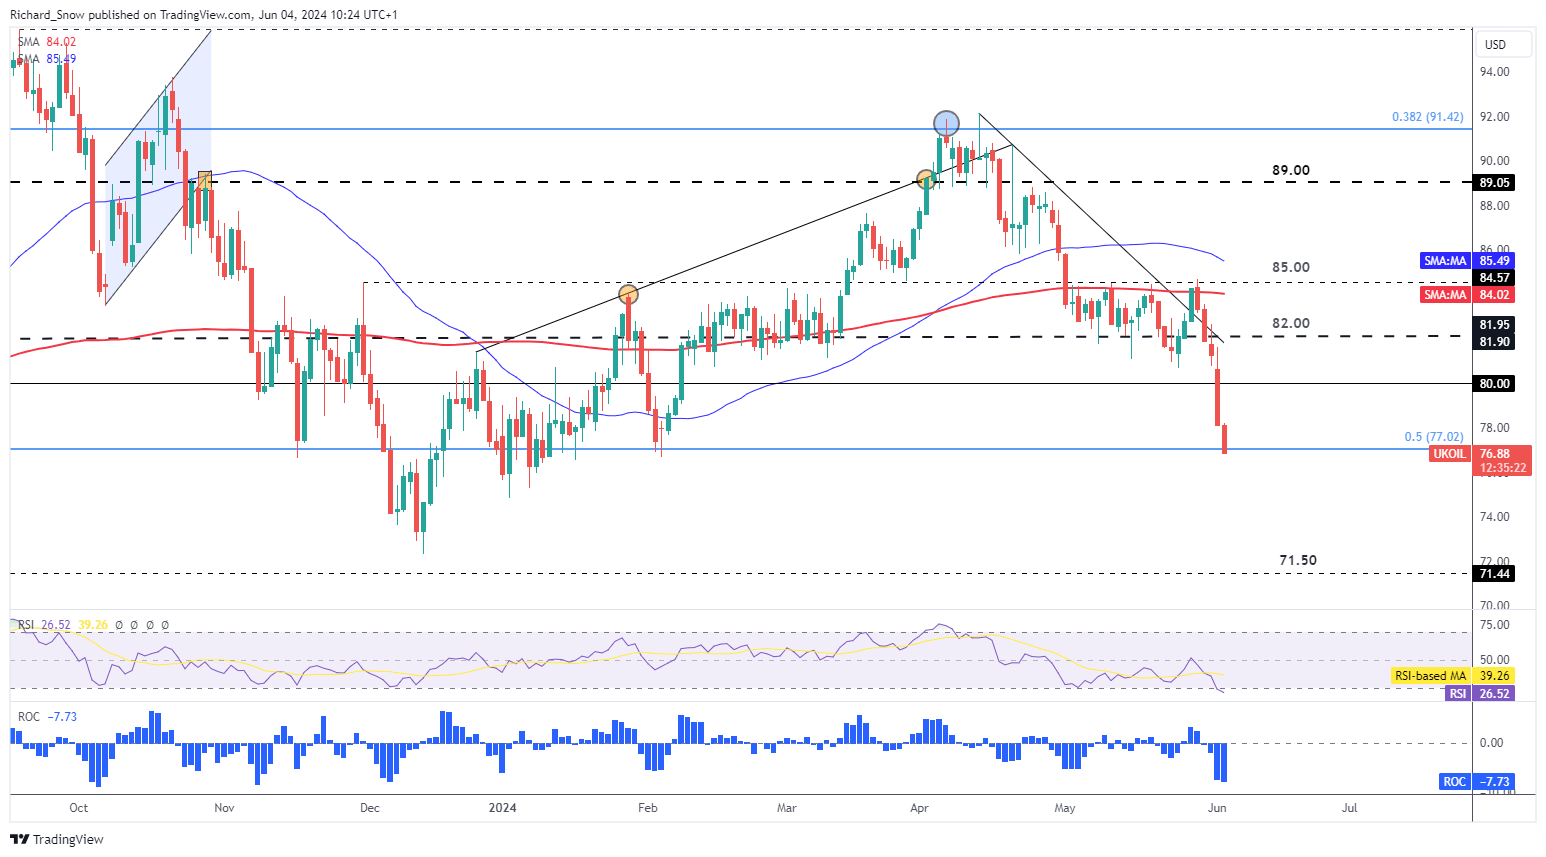
- Oil market takes a hit after OPEC+ plans to steadily reintroduce supply
- Discover the nuances behind trading gold and oil , two complex markets which remain sensitive to macro and geopolitical events
Commodities Start the Week on the Backfoot with US Jobs in Focus
Markets appear to have leaned towards a more cautious stance at the start of the week, with equities trading lower, bonds rising (yields falling) and the dollar struggling to show any signs of bullish potential.
Therefore, appetite for precious metals has waned despite a softer dollar and gold buyers appear to be sat on the sidelines awaiting crucial jobs data this week. Today, JOLTs data will get things underway as markets eagerly await further insight on the US labour market. Job openings, hires and the quitting rate will inform speculative bets on the dollar, inflation and by extension gold.
The quitting rate has links to inflation; if fewer people are quitting each month, this implies that workers are less optimistic in finding another suitable position and decide to stay in their current job. The result is there if less turnover in the job market which workers used to their advantage after the pandemic to secure higher salaries. In short, fewer quits means less inflationary pressure from salaries/wages which could see the dollar consolidate or even ease further.
Customize and filter live economic data via our economic calendar
However, the main event of the week remains NFP on Friday which is likely to have the greatest market impact.
Gold Consolidates within its Narrow Range
Gold prices have come off the most recent spike high after revealing negative divergence in May. More recently, gold has been stuck in a narrow range formed by the $2,320 support and $2,360 resistance which is the 1.618 extension of the major 2020 – 2022 decline.
The 50 day simple moving average has appeared to provide dynamic support and will also need to watched for a close beneath it if a bearish breakout is brewing. $2,277 is the next level of support with $2,431 the next upside level of resistance.
Gold (XAU/ USD ) Daily Chart