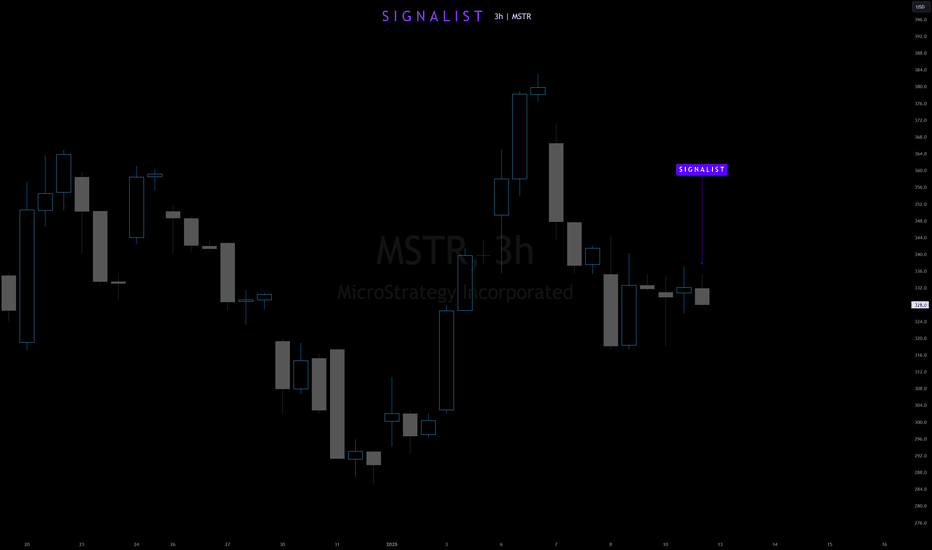
Major Price Movement Incoming for MSTR!

Signalist has detected a precise pattern in NASDAQ:MSTR trading activity, signaling that a substantial price movement is imminent. This isn’t a random fluctuation—it’s a carefully analyzed precursor to a significant market event. 📅 What to Expect: ⌛ Timeline: Anticipate a major move within the next 1 to 4 upcoming 3-hour candles. 📈 Monitor the Charts: Keep an eye on MSTR’s price action over the next few candles. Prepare Your Strategy: Whether you’re bullish or bearish, have your trading plan ready to capitalize on the move.

Read More
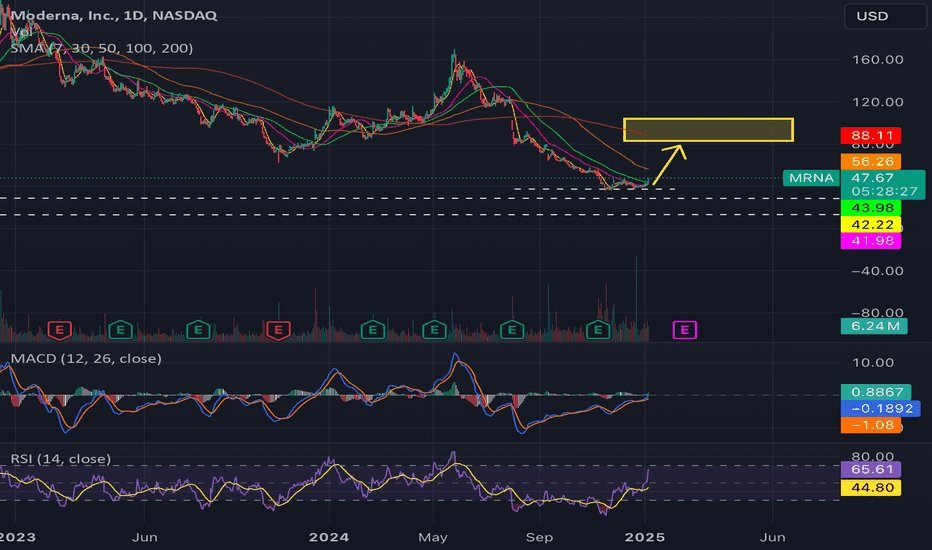
$MRNA to $90-115 | 100-150% upside in FY 2025

- NASDAQ:MRNA most of the people are familiar with the vaccine stocks from pandemic fiasco. - This company is beaten down to the ground and has low market cap as compared to other biopharma stocks. - 2025 would be easier for merger and acquisition which will be good for moderna as it might get acquired by other biopharma companies to accelerate their growth. - Bird Flu in the US and rise of HPMV in China will create an upward pressure in terms of demand of these stocks. Monitor the news for HPMV as it seems it is more severe than the COVID

Read More

Jailed crypto scammers blew stolen funds on shark tank, hookers: Report

Five people have been sentenced to prison for their roles in a $21.6 million crypto …

Read More

‘It’s Pissing Me Off’ Trump ‘Gets to Be Lawless’ While Harris ‘Has to Be Flawless’

CNN contributor and former Obama adviser Van Jones said Wednesday following his network’s presidential town hall …

Read More

Donald Trump Leading Kamala Harris Nationally by Three Points

Former President Donald Trump is leading Vice President Kamala Harris nationally by three points in …

Read More

Bitcoin price today: falls for 3rd straight day to $94k on Fed rate jitters

-- Bitcoin edged lower on Monday, falling for a third straight day as stronger-than-expected U.S. payroll data stoked caution among traders, reinforcing the Federal...

Read More

Enormous XRP Breakout to Launch Skyrocketing Rally, Shiba Inu (SHIB): Pattern You Don't Avoid, Bitcoin (BTC) Still Sleeping

U.Today - Finally, XRP has breached a crucial descending trendline resistance level, suggesting that a major bullish rally may be about to begin. After weeks of consolidation...

Read More

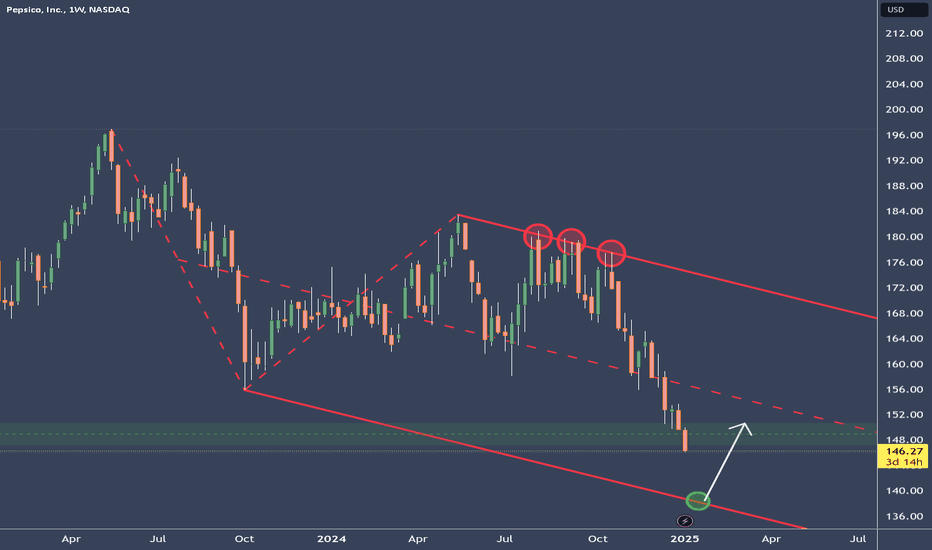
PEP - Stalking a potential Long in Pepsico

So far PEP reacted very well at the U-MLH. Now price is trading below the Center-Line and is approaching the L-MLH. Down there, price is heavily stretched. A good place to start looking for a long entry on the daily time-frame.

Read More

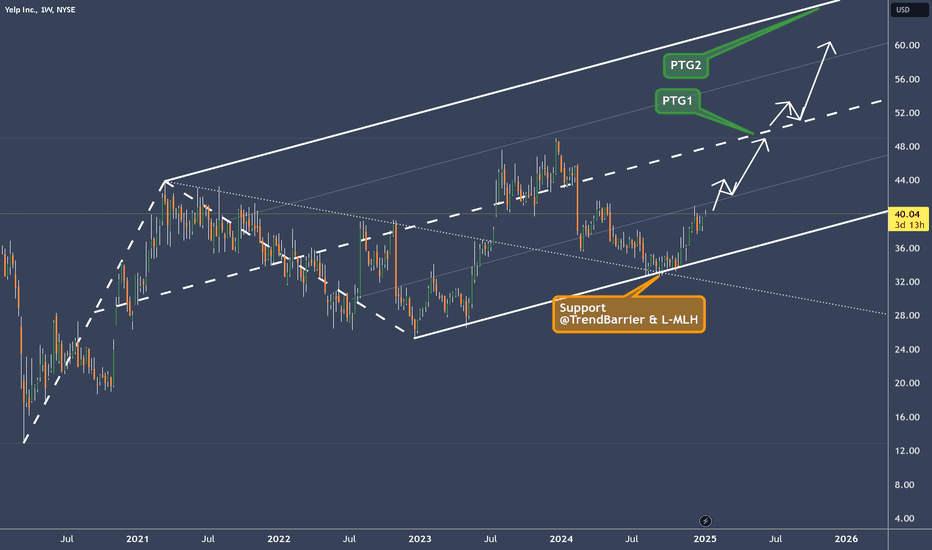
YELP projection long and good momo

Price is in a clear up-trend with wide pullbacks. Since July price was holding at the TB and L-MLH. The weekly momentum looks good to me. Although, a little concern could be the rejection at the 1/4 line. But this happened also in the past, and then, after a new attack, price took off. So, this definitely needs patience to play out. I maybe start with a little "feeler" position today. Above the 1/4 I would add more. Above the CL even more.

Read More

Nvidia supplier SK Hynix posts record quarterly profit, beating expectations

SK Hynix logo displayed on a phone screen as seen in this illustration photo taken …

Read More

Corn Closes Higher Following Robust Ethanol Data

Switch the Market flag for targeted data from your country of choice. Open the menu …

Read More

Stock Market Logic Series #13

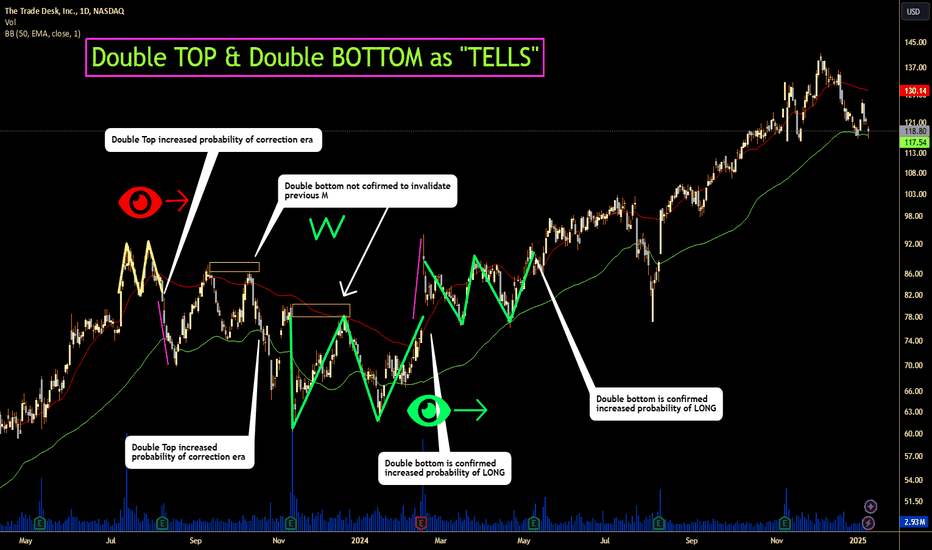
The double bottom and double top patterns are among the most powerful and reliable indicators in technical analysis. These formations provide traders with insights into potential trend reversals, making them valuable tools in a trader's arsenal. However, one must approach these patterns with patience and discipline to truly harness their power. Statistically, the price often does not move decisively on the first attempt, and waiting for confirmation can significantly improve the likelihood of a successful trade entry. A double bottom pattern occurs when a stock's price hits a low point, rebounds, and then retests the same low point before moving upward. This pattern suggests that the selling pressure is diminishing, and buyers are starting to take control. Conversely, a double-top pattern forms when the price reaches a high point, retraces, and then retests the same high point before moving downward. This indicates that buying pressure is waning, and sellers are gaining the upper hand. One of the key aspects of trading these patterns is patience. It's essential to wait for the price to confirm the pattern before entering a trade. For a double bottom, this means waiting for the price to break above the resistance level formed between the two lows. For a double top, it involves waiting for the price to break below the support level formed between the two highs. By waiting for these confirmations, traders can avoid false signals and increase their chances of entering a profitable trade. This is because you will not fall into the trap of HINDSIGHT backtesting and it is clear that an M or W happened. HINDSIGHT backtesting is that you have the hindsight advantage when you backtest, but you don't have it when you do REAL-TIME trading. FYI, TradingView gives you the ability to do a reply of bars ... This gives you the dramatic advantage of seeing if your trading rules are REAL-TIME approved. Patience is particularly crucial because, statistically, the price often makes multiple attempts to break through these key levels. Impatient traders who jump in too early may find themselves caught in a false breakout or worse an "imaginary breakout", resulting in losses. By waiting for the price to confirm the pattern, traders can ensure that the trend reversal is genuine and increase their odds of success. Imaginary breakout is when you imagine the price will do what you believe it will do, and it never does it. This cognitive error causes you to enter trades you would have never taken when you backtested your strategy. John Bollinger, the creator of the Bollinger Bands, recognizes the power of double bottom and double top patterns. Bollinger Bands are a popular technical analysis tool that measures market volatility and provides a dynamic range within which prices are likely to move. When combined with double bottom and double top patterns, Bollinger Bands can further enhance a trader's decision-making process. TradingView also functions as the best Trading Journal , I have my whole series of stock market logic ideas which I always refer back to. Also, you can add inside the journal idea a picture of the chart that is automatically stored and displayed on the TradingView ideas. What you see on the chart is a confirmed validated M-pattern (the pink is the manifestation of the pattern), then after it you see a period of "NOT LONG". This gives you a "TELL" that the probability of the rallies... they are fake. Then, you see a confirmed W-pattern (the pink is the manifestation of the pattern), then after it, you see a period of "LONG". This gives you a "TELL" that the probability of the corrections... they are fake. When YOU, yes YOU, "KNOWS" statistically, when a fake pricing happens... this is a very lucrative business opportunity...

Read More

Better Know a Crypto Candidate: Jerrod Sessler

Jerrod Sessler is running for Washington’s 4th Congressional District in the United States House of …

Read More

What a Rapidly Aging World Population Means for Your Long-Term Portfolio

Switch the Market flag for targeted data from your country of choice. Open the menu …

Read More